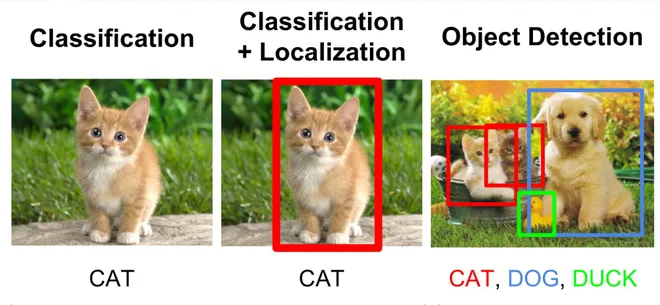
Object Detection : is a computer technology related
to Computer vision and Image Processing that deals with detecting
instances of semantic objects of a certain class (such as humans,
buildings, or cars) in digital images and videos.
Classification : is a process related to
categorization,the process in which ideas and objects are
recognized, differentiated and understood.
Localization : Placing a rectangular box for
classified objects.
Why YOLO?
The R CNN family of techniques used to localize the objects within
the image. The network does not look at the entire image, only at
the parts of the images which have a higher chance of containing an
object.
The yolo framework, on the other hand, deals with object detection
in a different way. It takes the entire image in a single instance
and predicts the bounding box coordinates and class probabilities
for these boxes. The biggest advantage using yolo is its superb
speed – it’s incredibly fast and can process 45 frames per second.
yolo also understands generalized object representation. This is one
of the best algorithms for object detection and has shown a
comparatively similar performance to the R CNN algorithms. So for
better results we are using yolov4 for developing custom object
detection.
How YOLO (You only Look once) Works?
Contents :
- What is YOLO and Why is it Useful?
- How does the YOLO Framework Function?
- How to Encode Bounding Boxes?
- Intersection over Union and Non-Max Suppression
- What is YOLO
Yolo is an algorithm that uses neural networks to provide real-time
object detection. This algorithm is popular because of its speed and
accuracy. It has been used in various applications to detect traffic
signals, people, parking meters, and animals. Yolo model process 45
frames per second then any other detecting models.
How does YOLO work?
After reading an Image YOLO splits the Image into 19 * 19 grids. For
better understanding will take 3 * 3 grid image example
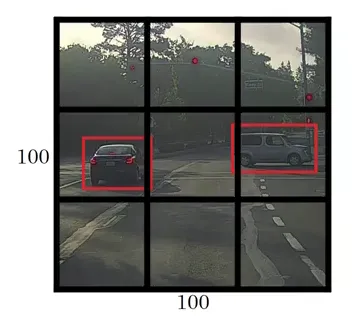
From the above Image 3 * 3 grid each grid will be considered as an
individual image and sent to the Neural Network. If the Images label
founds in the grid will collect the 4 Parameters from the grid
- Height
- Width
- X_Coordinates from the mid Point of the label
- Y_Coor dinates from the mid Point of the label
How YOLO Train Images?
We need to pass the labelled data to the architecture in order to
train it. Suppose we have divided the image into a grid of size 3 *
3 and there are a total of 3 classes which we want the objects to be
classified into. Let’s say the classes are Bus, Car, and Person
respectively. So, for each grid cell, the label y will be an eight
dimensional vector:
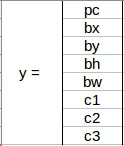
Here,
- pc defines whether an object is present in the grid or not (it is the probability)
- Probability range 0 to 1.
- height, Width, x coordinate, y coordinate, specify the bounding box if there is an object
- c1, c2, c3 represent the classes. So, if the object is a car, c2 will be 1 and c1 & c3 will be 0, and so on
Let’s say we select the first grid from the above example:
Since there is no object in this grid, pc will be zero and the y
label for this grid will be:
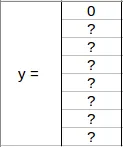
Means that it doesn’t matter what height, width, x coordinate, y
coordinate, c1, c2, and c3 contain as there is no object in the
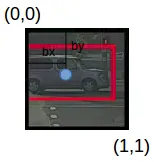
grid. Let’s take another grid in which we have a car (c2 = 1):

In the above image, there was a car , So YOLO will take the
mid-point of these objects . The y label for the center left grid
with the car will be:
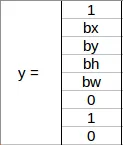
Since there is an object in this grid, pc will be equal to 1. H , W
, X Coordinate , y Coordinate will be allocated . Since a car is the
second class, c2 = 1 and c1 and c3 = 0. So, for each of the 9 grids,
we will have an eight dimensional output vector. This output will
have a shape of 3 X 3 X 8
How does bounding boxes really work?
If we found a label in one grid then Yolo takes care of finding
their height, width, and both coordinates.

there is a (label) car in one grid
collecting the values from the grid and y will be =
height , width , X and y values are updated according to the label
found inside the grid . This will happen for every grid in an image.
Intersection Over Union:
IOU = AREA OF INTERSECTION / AREA OF UNION
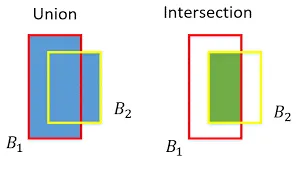
Union over Intersection Measure the overlap between two bounding
boxes During training we calculate the IOU between the predicted
bounding box and the ground truth (the pre labelled bonding box we
aim to match )
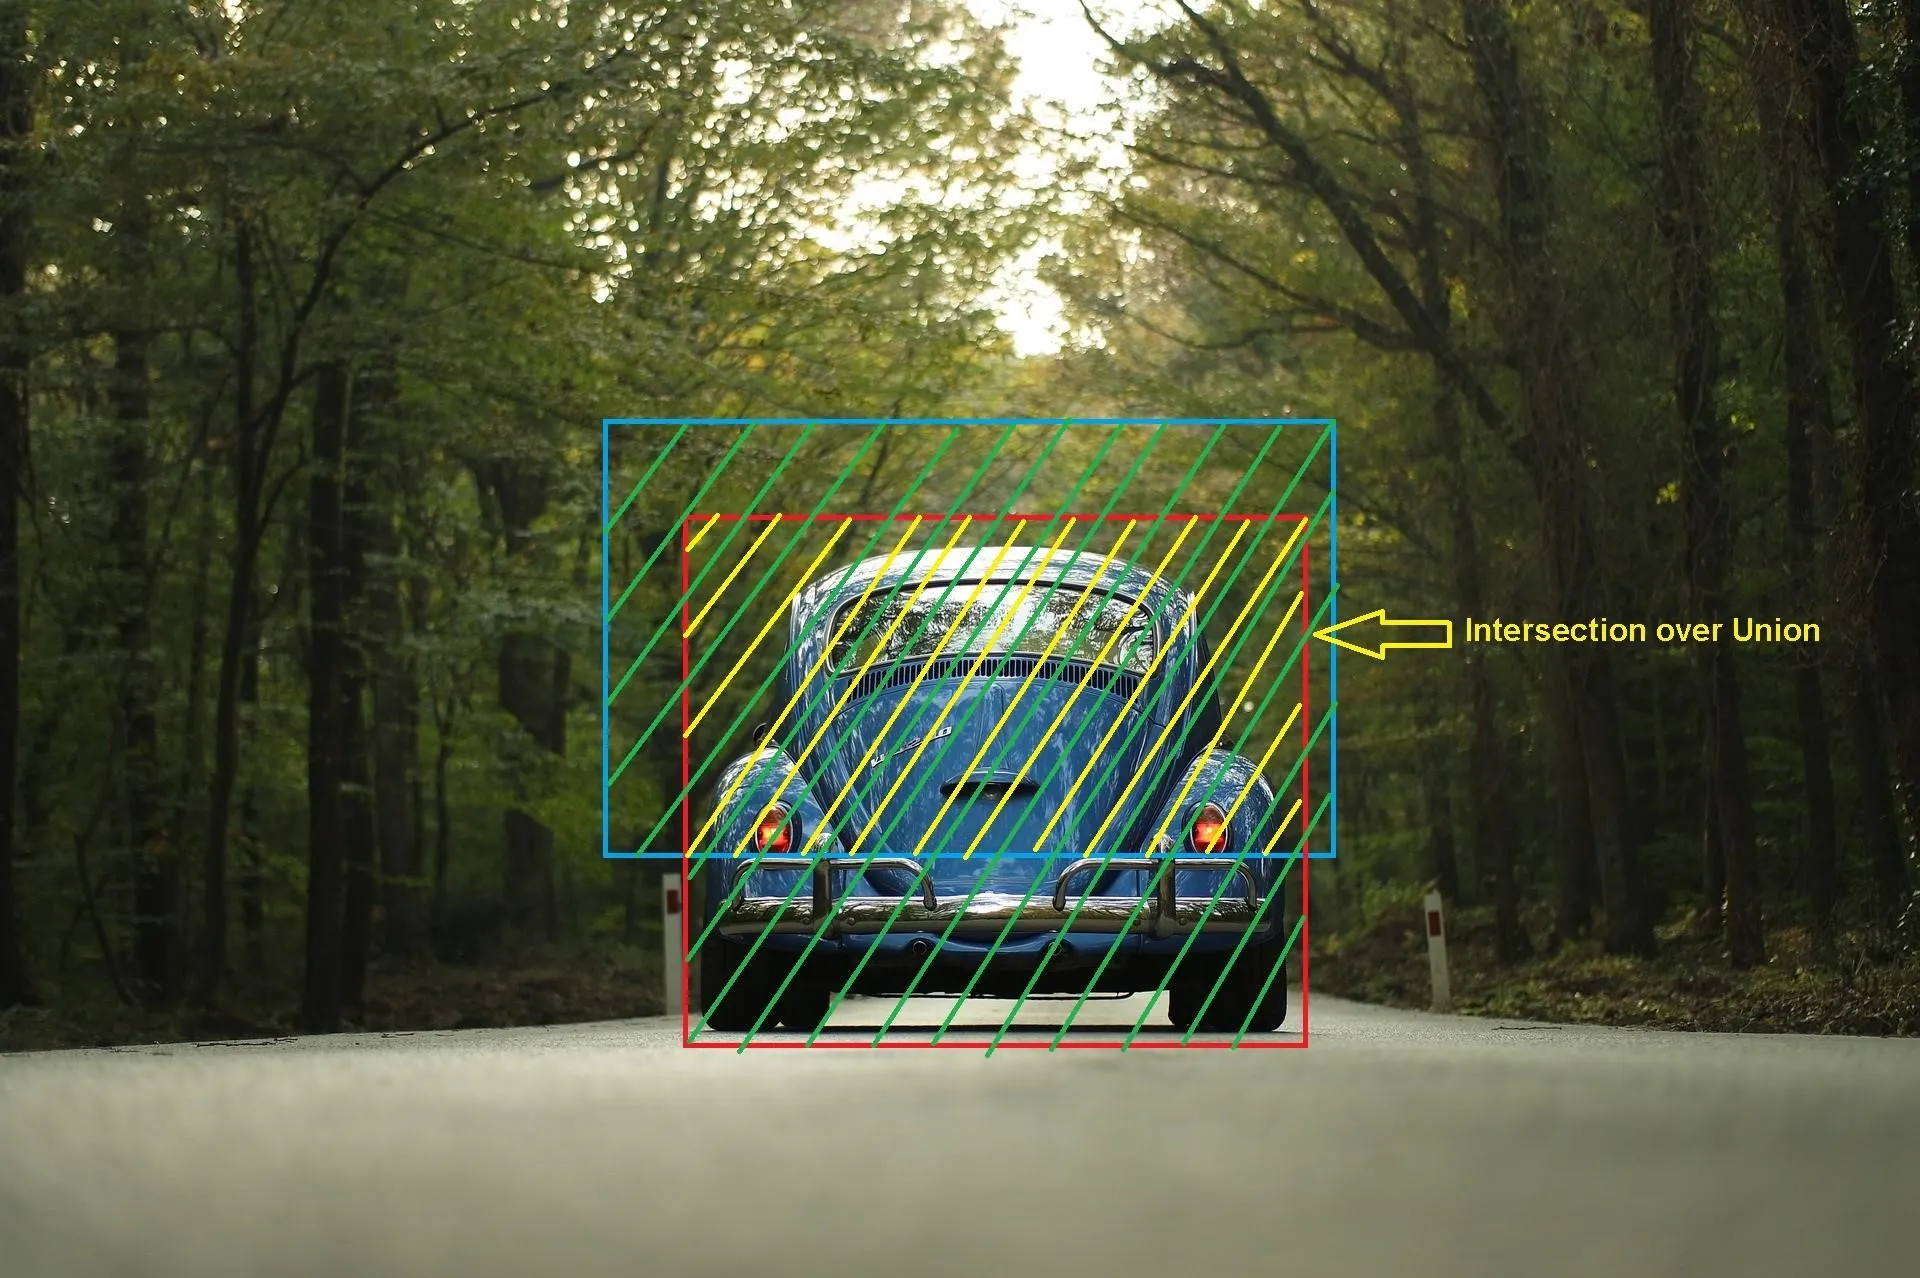
If IOU value > 0.5 that predicted bounding is a good boundary or < 0.5 not a good boundary.
Non Max Suppression:
Non max suppression means in an image the grids are 19 * 19 Each
grid will think it is a midpoint. So on every iterations during
training we will get different boundary predicted positions like
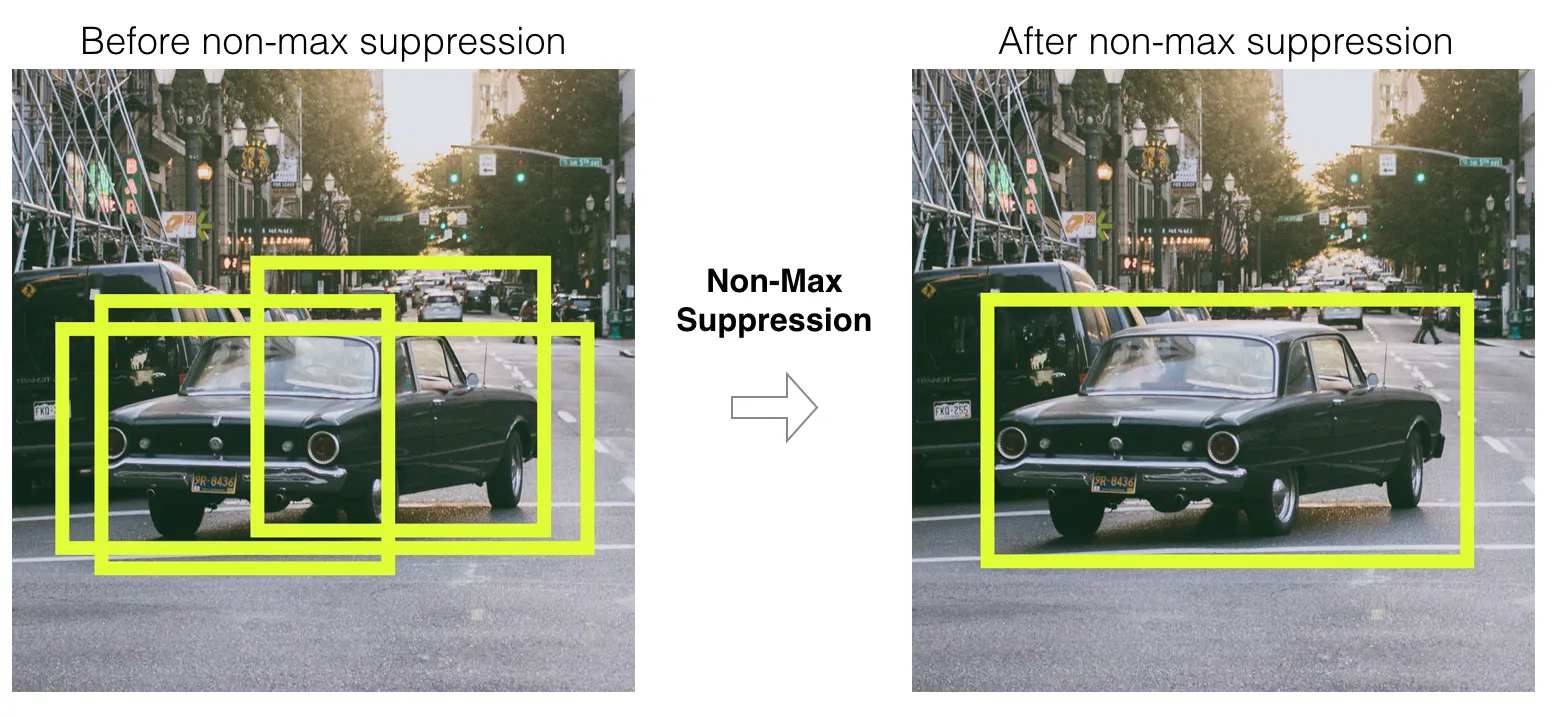
So from among these we will select the boundary which has a high Pc
value. High Pc boundaries will be selected and these undergo the
IOU concept with the neighbor boundary in the grid. If The IOU
value is > 0.5 for that particular Pc it is considered as a perfect
boundary.
Yolo V4 on coco dataset:
Yolo V4 model were Trained on coco dataset where there will be 80
different labels. It is very easy to test our own labels using
pretrained weights. For this purpose we used a framework called
darknet.
Ex:
- person
- bicycle
- car
- Motor Bike
- aero plane
- Bus
- train
- truck
- boat
- traffic lights etc..
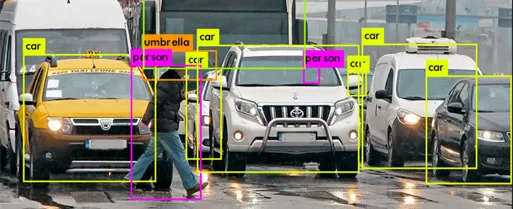
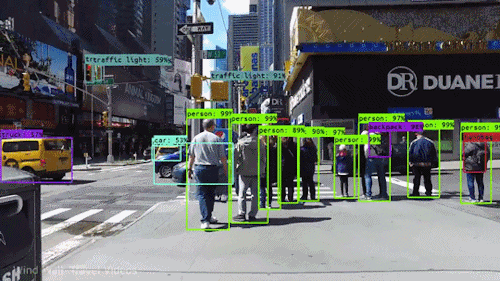
Finding detections on video :
How to do it for our own data?
For developing our own object detection model we need to select
labels that we want to detect and annotate them in yolo format. For
annotating the images we are using a tool known as labellmg.
labelling own data for object detection
For creating our own object detection we need to collect the data
from external sources. Collected 10 different label data from Kaggle
and some other websites now our main task is to annotate the Images
into Yolo format. For that purpose I am using an tool known as an
Labellmg tool.
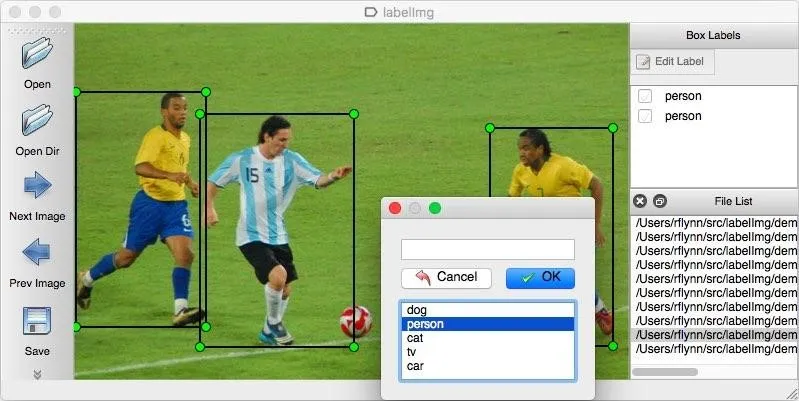
In the first step select the directory of the images and apply a
rectangle box for every label in the image.
What happens if we apply a rectangle box?
we will get their x coordinate , y coordinate , height and width .
and wee need to specify class label also for every image . by doing
this process we will get images and their annotated file.
Custom object detection
Multiclass object detection
Developing an custom object detection using 10 Labels
The yolo implementations are amazing tools that can be used to start
detecting common objects in images and videos. However there are
many cases, when the object which we want to detect is not part of
the popular dataset. In such cases we need to create our own
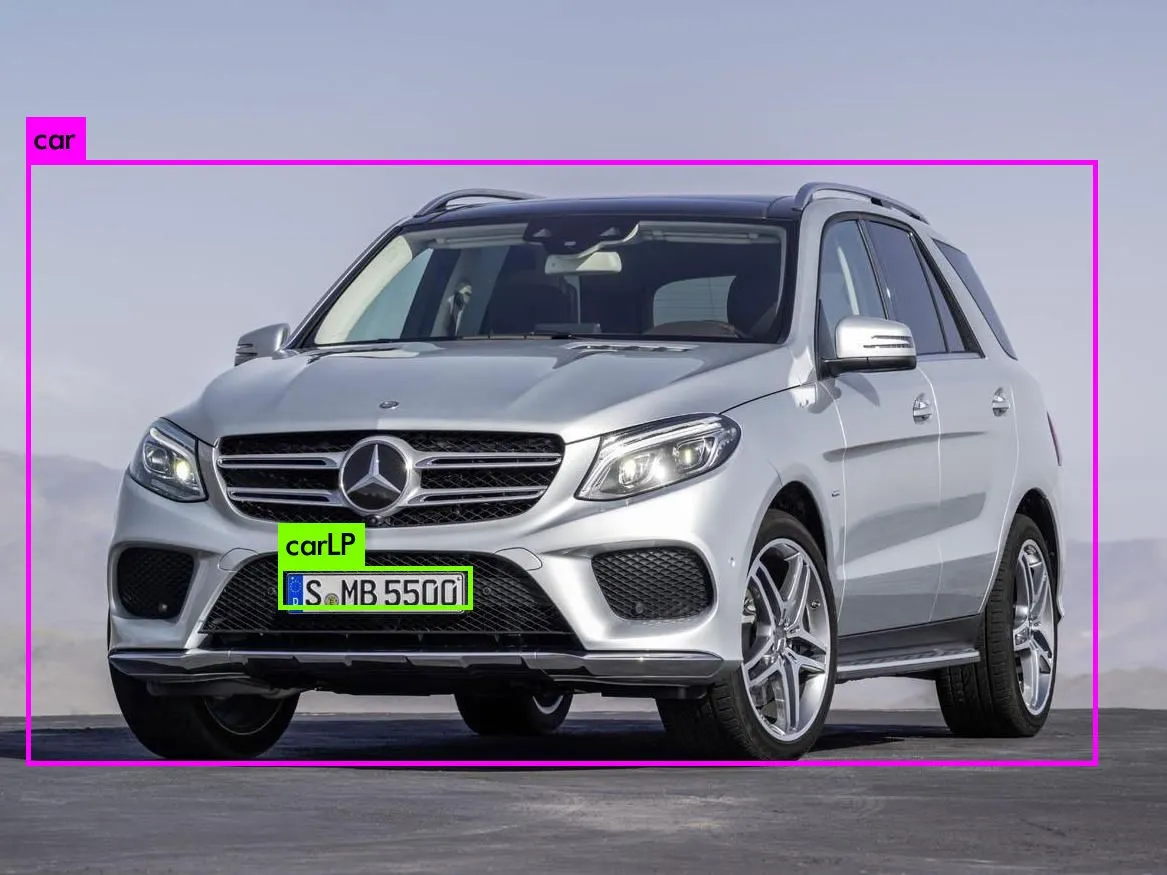
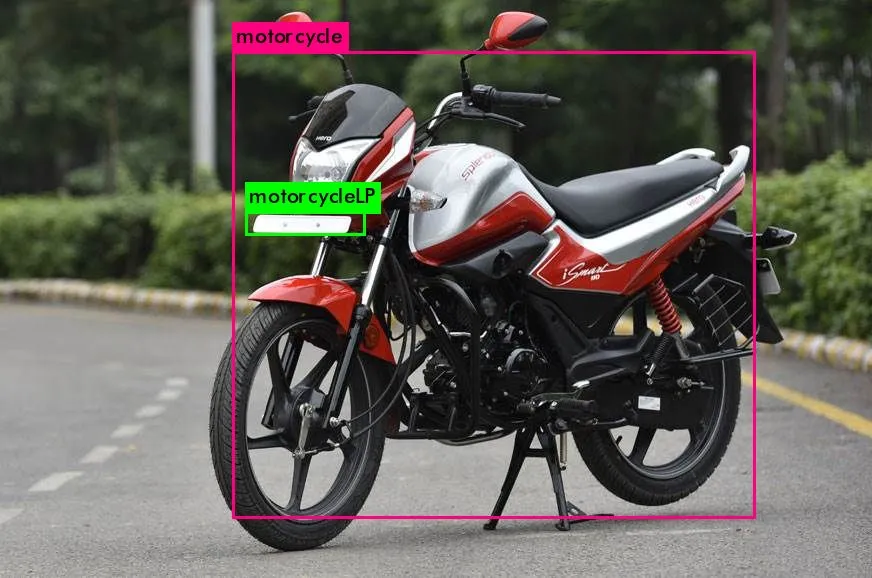
training set and execute our own training. Vehicle and its License
plate detection are one such case. We have used yolov4 to detect the
desired classes.
- car – 0
- truck – 1
- Bus – 2
- Motor Cycle – 3
- Auto – 4
- car LP – 5
- truck LP – 6
- Bus Lp – 7
- Motor Cycle – 8
- Auto LP – 9
Later splitted all the dataset in training and validation set and
stored the path of all the images in file named train.txt and
valid.txt
Configuring Files
Yolov4 needs certain specific files to know how and what to train.
- Obj.data
- Obj.names
- Obj.cfg
obj.data
This basically says that we are training 10 classes, what the train
and validation files are and which file contains the name of the
object we want to detect.During training save the weight in the
backup folder.
- classes = 10
- train = train.txt
- valid = test.txt
- names = obj.names
- backup = backup
obj.cfg
Just copied the yolov4.cfg files and made a few changes in it.
- Set batch=24 to use 24 images for every training step.
- Set subdivisions=8 to subdivide the batch by 8 to speed up the training process.
- Set filters=(classes + 5)*3 , e.g filter=45.
After completing the training part total accuracy score 89%. For
better model performance we need to increase the accuracy score.
Steps used to increase the accuracy
- Data Augmentation
- Increasing the subdivisions for each batch
- Trained the model with 6000 Iterations
- After applying all 3 above steps and once again training has been done. the accuracy has increase by 94%
What is Data Augmentation
Techniques are used to increase the amount of data by adding
slightly modified copies of already existing data or newly created
synthetic data from existing data . So data augmentation involves
creating new and representative data. some images rotated with 40
and some with 180 , 270 etc.
- Rotation_range = 40
- width_shift_range=0.2
- height_shift_range=0.2
- shear_range=0.2
- zoom_range=0.3
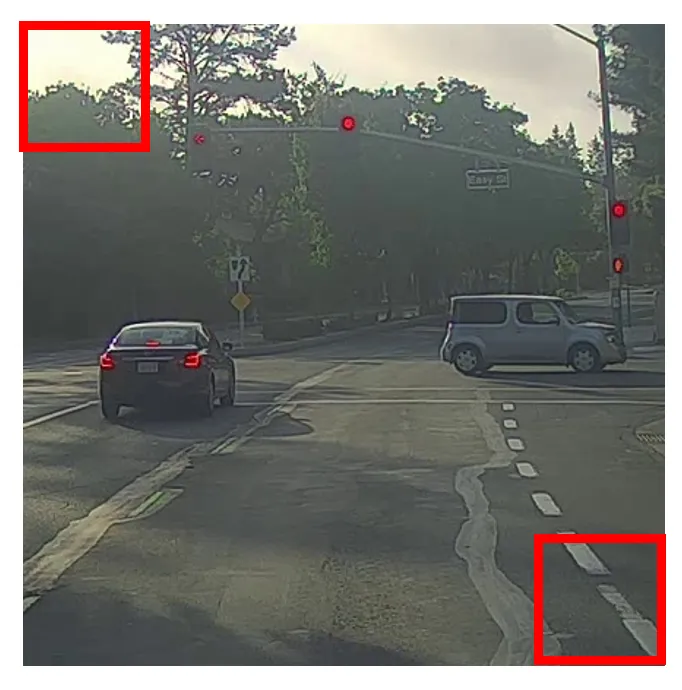
Final result on a Video :